In my previous post I covered the motivation for this project and sketched out my first ideas. This post is going to dive into my first attempt of data collection, including my considerations, some insights into the data and the tools I used for labeling.
The role of data
Collecting data is arguably one of the most important continuous tasks during the machine learning lifecycle. Without proper data, training might be useless or at least less effective, since data is the base input for this process. However, the biggest question is: how do I get this data?
The Cold Start Problem
This question is the primary challenge of the "Cold Start Problem". This term was originally coined for recommender systems, but also fits into a general machine learning context. The core issue: you need data to train and evaluate an ML model before any feedback loop for improvement can exist. How do I get the data I need to provide the function I want to realize?
There are a few options for mitigating this, ranging from manual collection and labeling to fully automated data synthesis, and anything in between. To keep things simple and controllable, I started with manual data collection and added some semi-automated collection and labeling later.
My Data Collection Process
My strategy involved the following steps:
- Create records of my doorbells (I have multiple sounds depending on the door I need to answer)
- Create records of the background noise (anything which is not any of my doorbells)
- Create records of my doorbells with background noise
My intention was to stage recordings for each of these scenarios.
Looks like a simple three step approach and it's fairly naive. It didn't consider edge cases, but for the first try it was enough. I wanted to have a rough estimator at the beginning based on simple handmade rules to continuously collect data. Afterwards I planned to label the captured recordings manually and start training my first model.
So, what handmade rule should I build for data collection?
Dive into the data
To get a grip on the data I picked some examples and visualized them with a few statistical measurements. They look like this:
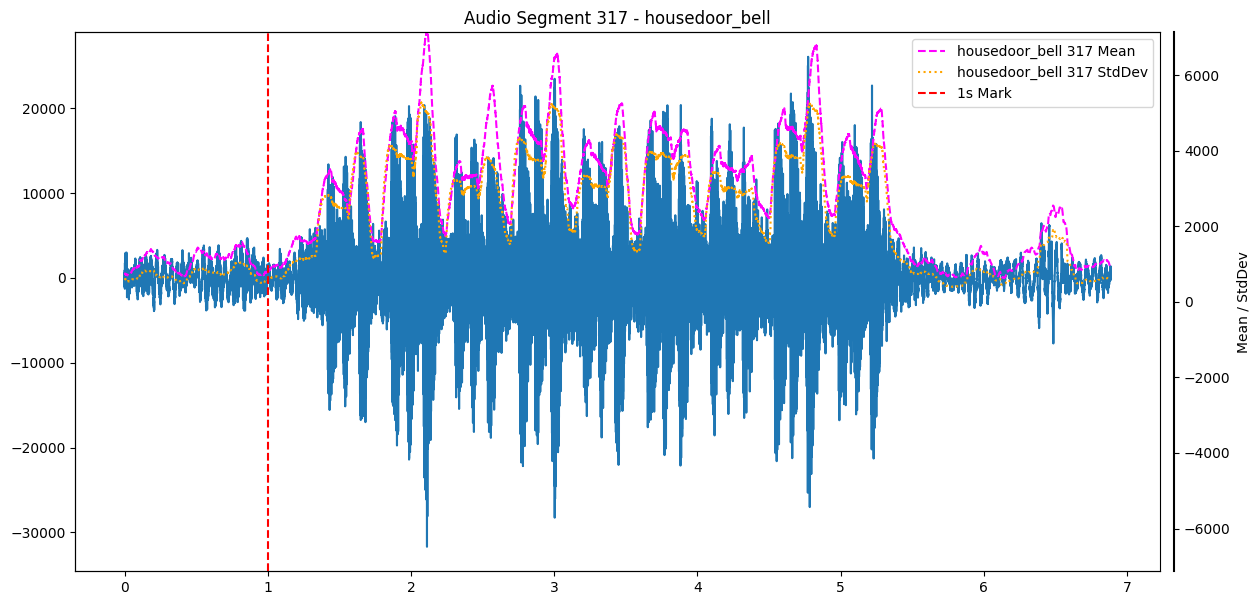
The dashed red line marks the start of the jingle. I also added the mean (dashed magenta) and the standard deviation (dashed yellow) of the absolute amplitude, both computed over a sliding window of 100ms. Using the absolute amplitude matters here: the raw waveform is zero-centered, so its sliding mean would hover around zero no matter how loud the signal gets. Taking the absolute value first gives a measure that actually tracks loudness — which is what the threshold rule below relies on.
The base rule was found pretty quickly: always keep about 1s of recording in a buffer (so nothing is missed) and as soon as the mean within my 100ms window surpasses a threshold, start recording for 6 seconds, which is roughly the length of my doorbell sounds plus some margin. The threshold is a rough manual estimate from a few clean samples compared to recordings with no sound, so only the white noise background.
The plot above looks quite appealing, but I also got some doorbell recordings with noise:
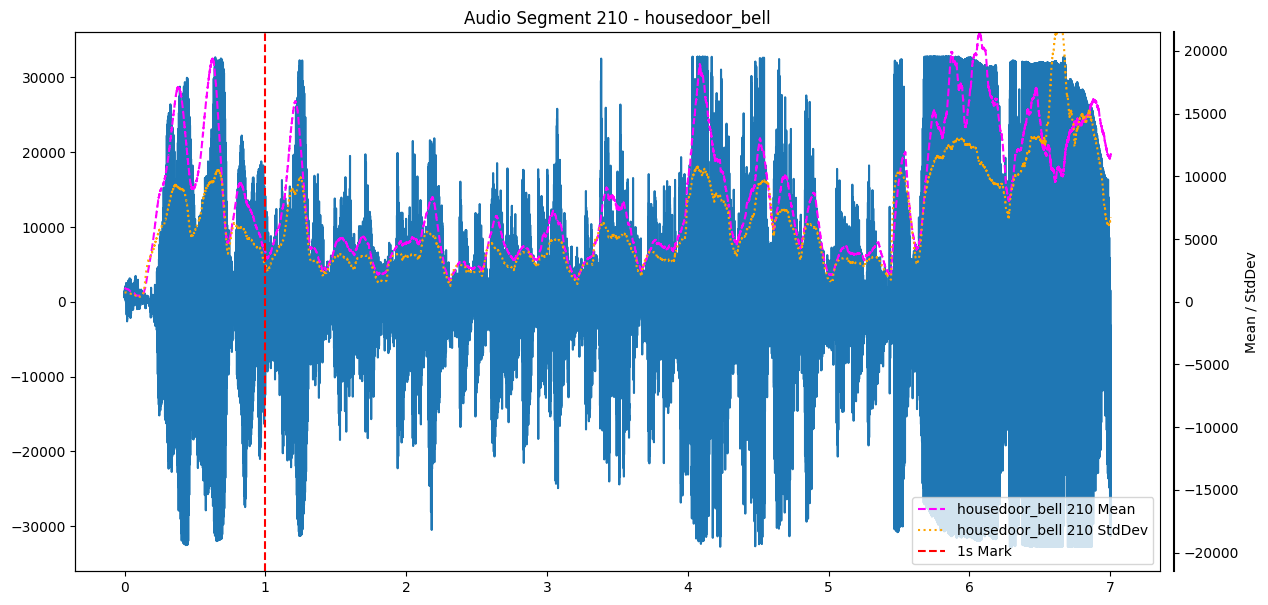
I cannot remember what it was, but the characteristics of the doorbell isn't visible anymore, at least in this vizualization. For the sake of completeness, here are spectrograms of these audio segments:
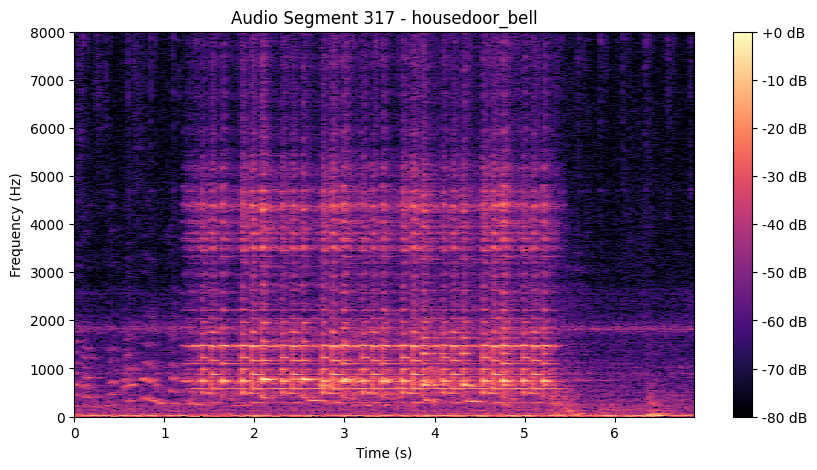
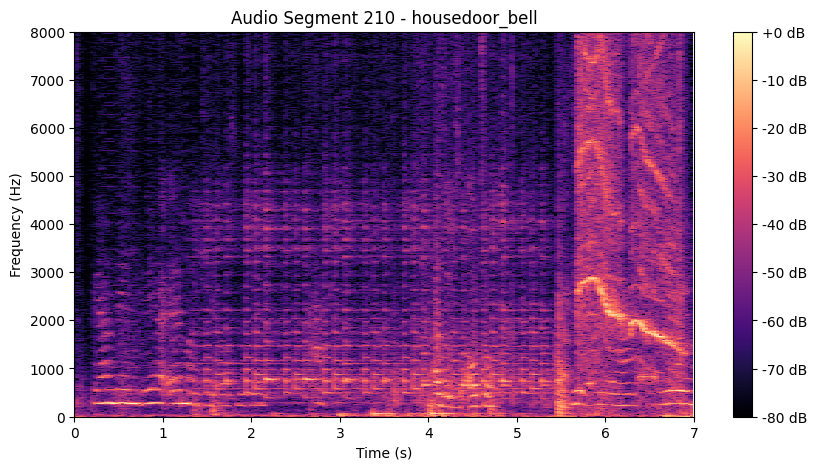
In the clean recording you can make out the jingle's harmonic structure, distinct horizontal frequency bands that light up right after the red line. In the noisy recording those bands are largely washed out, so the start of the jingle is much harder to pin down. This clip does contain a real ring, but the surrounding noise alone would likely have crossed my threshold too, a good reminder that the rule can't tell a loud doorbell from loud background on amplitude alone.
However, I got my threshold based rule: simple, nice and with a lot of potential for false positives, i.e. detecting doorbells which are not there. I deliberately kept the threshold low and accepted those false positives, following the "the more data the better" mindset. The same low threshold also keeps false negatives down, since any real doorbell ring should comfortably exceed it. Well, let's see what happened later.
Labeling
I worked with CVAT Community Edition before to manage image data, so I wanted something similar to handle labels systematically. CVAT itself was unfortunatly only designed for image and video annotation, so not usable for my purpose.
So I searched for an alternative and settled on Label Studio, since it also supported audio data and was open source. After taking a deeper look at the versatile label templates, I would also consider it for future computer vision projects. I labeled parts of the clip within the visual editor with the labels front_door, flat_door, garden_door, ambient/background (I was a bit inconsistent for the name of the negative class).
I setup my Label Studio instance as a docker container within an LXC container on my homeserver, so I keep the complete setup within my local network. This decision is partly driven by privacy, even though I have a few Alexa devices running. Continuous raw audio of my home is a different beast than the wake-word snippets those devices send off, so keeping it local still matters to me. On the other hand I already got a significant amount of infrastructure at home, so underutilizing it seemed to be wasteful to me.
Capture Device -> Labeling Instance
As mentioned in my previous post I use an Raspberry Pi Zero W with a microphone hat. So, how do I transport recordings to my Label Studio instance? I decided to use an SMB share, since it's already provided by my router. It's been mounted to both, the Microphone SBC and the Label Studio host container, and synced via Label Studio's local storage sync.
First load of data incoming
As already mentioned, I decided to go with a simple threshold approach for data collection. So I prepared the Raspberry Pi Zero with the microphone hat (which was an odyssey itself, but that's another story) and placed my recording script. For some time it worked quite well — typical false positives were voices and slamming doors. However, it worked until my vacuum robot hit, which generated a big amount of data just with noise. Luckily I was aware of this because I supervised the recording campaigns and got proper timestamps, so I used the Label Studio API to automatically label all these vacuum records as background. Since I supervised those windows, I knew no doorbell rang during them, otherwise bulk-labeling every vacuum clip as background would have risked burying a hard positive example (a ring masked by the vacuum noise) in the negative class. In the end the distribution looked like this:
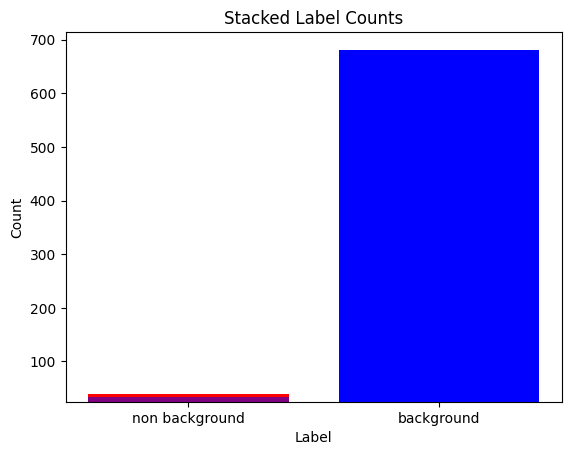
Internally I distinguished between different doorbell types, which is why I chose the stacked histogram for visualization. You may see the heavy skew in my dataset, a few dozen doorbell recordings vs almost 700 recordings for background, collected over roughly 2 days of recording. That timeframe also hints at how slowly the positive class grows: real doorbell rings are simply rare events, so even patient collection only adds a handful per week. This left me struggling during training, but this is something for the next post.